
Guide to Completing a
Spearhead Assessment
Spearhead is an accurate assessment that is focused on identifying the strengths and weaknesses of a single-site manufacturing operation. The assessment produces a report containing an analysis of operational effectiveness, recommendations for improvement and financial benefits forecast.
The assessment focuses on seven key components that influence both operational and financial performance. These are divided into six sub-components, each with five levels of grading resulting in a comprehensive view of the operation.
Spearhead is an inclusive process that enables selected contributors to add their knowledge and experience to the overall assessment. Each contributor is assigned one of three assessment questionnaires; Aspiration, Current or Aspiration plus Current. The responses are uploaded automatically to the consolidation table in the Lead Assessor’s dashboard where they can be reviewed and combined to create the final result.
The results of the assessment are used to produce reports containing the effectiveness of the operation, improvement actions and their financial benefits. Improvements are logged and their impact tracked via the Dynamic Dashboard.
Select Contributors
There is no limit to the number of contributors, however, it is advisable to only select people whose contribution you value for setting either business aspirations and/or establishing the current status. For example, these could be directors and key managers for setting ‘Aspirations’ and managers, key function leaders, influencers and people whose opinion is valued for establishing the ‘Current’ status. Contributors are sent assignments.
NB: By involving key people, you generate ‘buy-in’ to the final result and potential leaders for the actions that follow.
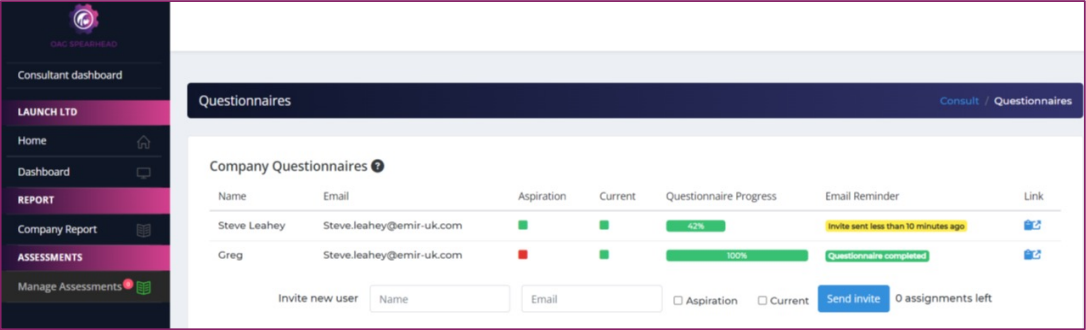
Assignments
Contributors are listed on the ‘Questionnaires’ input screen. You select their assignments and enter their email address. An email invitation to complete an assignment is sent to each contributor explaining the process and providing a unique link to their assigned questionnaire. The link remains ‘Live’ until the assignment is completed. The assignees progress is monitored via this screen and you can send reminders to expedite completion.
NB: All assignments must be completed before the responses can be consolidated into a finalised result.
The Questionnaire
The assessment focuses on seven components that influence both operational and financial performance. These components are divided into six sub-components, each with five levels of grading. To complete their assignment, the individual will select the statement in the questionnaire that best describes either the Aspirational goal or Current state for each sub-component.
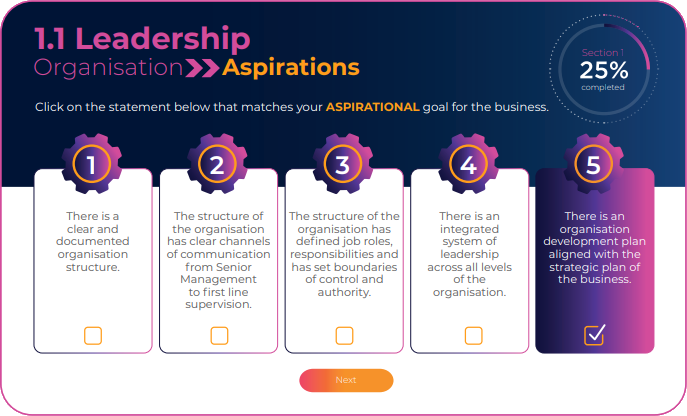
Aspiration
Select the statement that best describes the strategic Aspirations of the operation for the sub-component displayed e.g. Organisation.
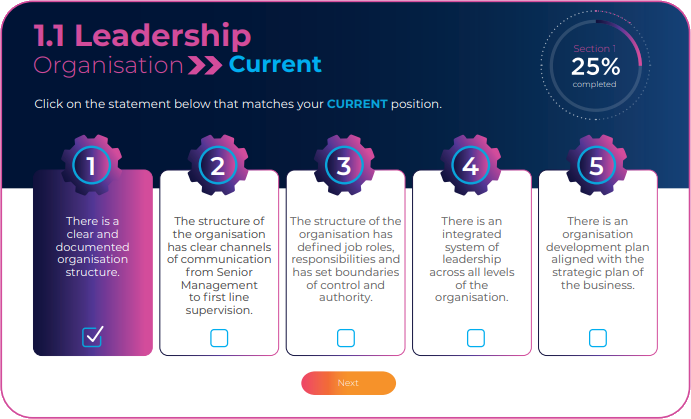
Current State
Select the statement that best describes the Current state of the operation for each sub-component. Collectively, these grades will form a baseline for the operation.
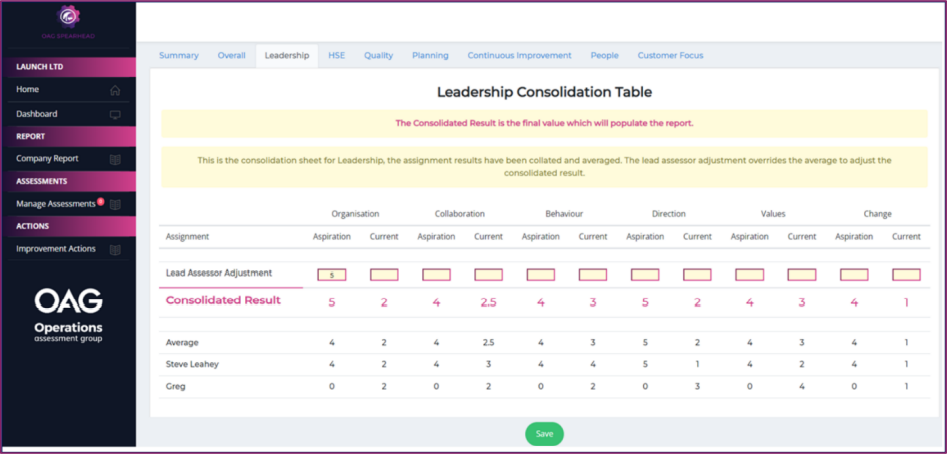
Consolidation Tables
On completion of their questionnaire, an individual’s responses are recorded in the seven components ‘Consolidation Tables’. The collective scores are averaged to create a consolidated result; however, the Lead Assessor can make adjustments to better align the results and override any distortions via the ‘Lead Assessor Adjustment’ row. Once you are satisfied that the ‘Consolidated Result’ represents the operation’s aspirations and current state, select ‘Save’ to finalise and submit the result. This is done for each component.
NB: You can view the ‘Overall’ and ‘Summary’ tables for the operation showing the combined result for all components.
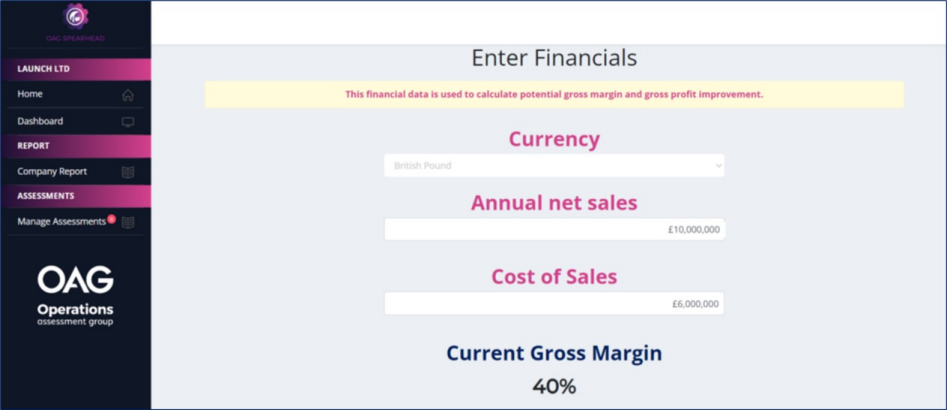
Financial Benefits Calculation
This calculation is a combination of the assessment result, the current gross margin and the improvement expectation. Typically, Operations are accountable for 60% of total business costs and are the main influence on gross margin performance.
NB (1): For a CoS figure, combine projected annual labour plus annual material costs.
NB (2): Transport costs have been ignored for the internal improvements’ calculations, however, improvements in the seven components will have a positive effect on transport costs.
Improvement Selection
The financial benefits calculation relies on you entering your improvement expectation for each component.
The OAG Allocation is the default maximum improvement expectation for each component based on averaging industry norms. The OAG allocation percentages can be used or adjusted by using the ‘Lead Assessor Adjustment’ column to better represent your expectations of improvement potential.
Once satisfied that the financial data and improvement percentages represent a final view, the ‘Save improvement values’ is selected to finalise and submit the result.
Reports
With the data collection completed and finalised, the reports are now available to view and download. The reports contain the assessment results, analyses, improvement actions to achieve your aspirations and the financial benefits of doing so.
These reports are saved and accessible once you are signed in to the OAG website.
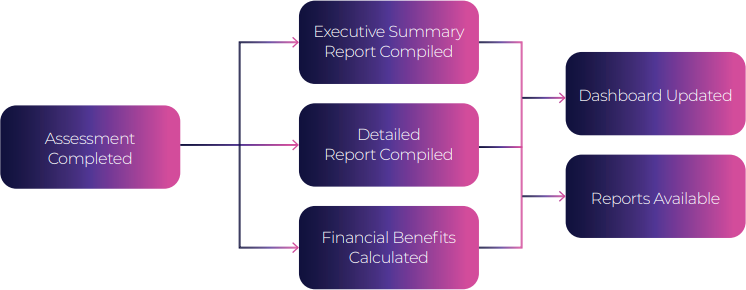
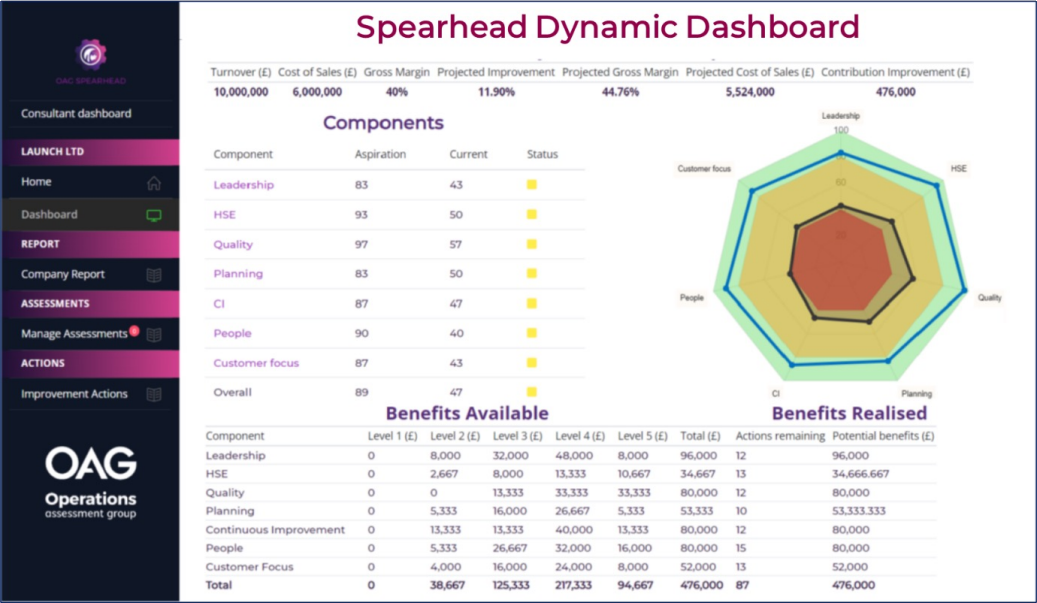
Dynamic Dashboard
The assessment data is uploaded to the dynamic dashboard. From here you can review reports from the overall result to any component and its subcomponents. This enables the detailed analysis of the strengths and weakness of the operation. It also shows the financial benefits for achieving aspirations, thereby helping to prioritise investment for improvement. As improvements are made, the dashboard logs completed actions and the resulting financial benefits.
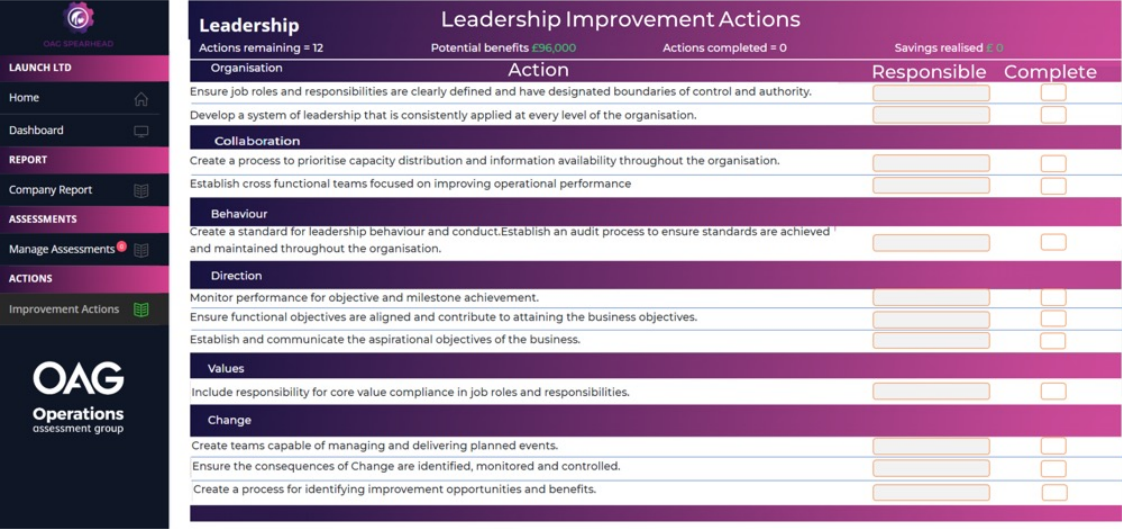
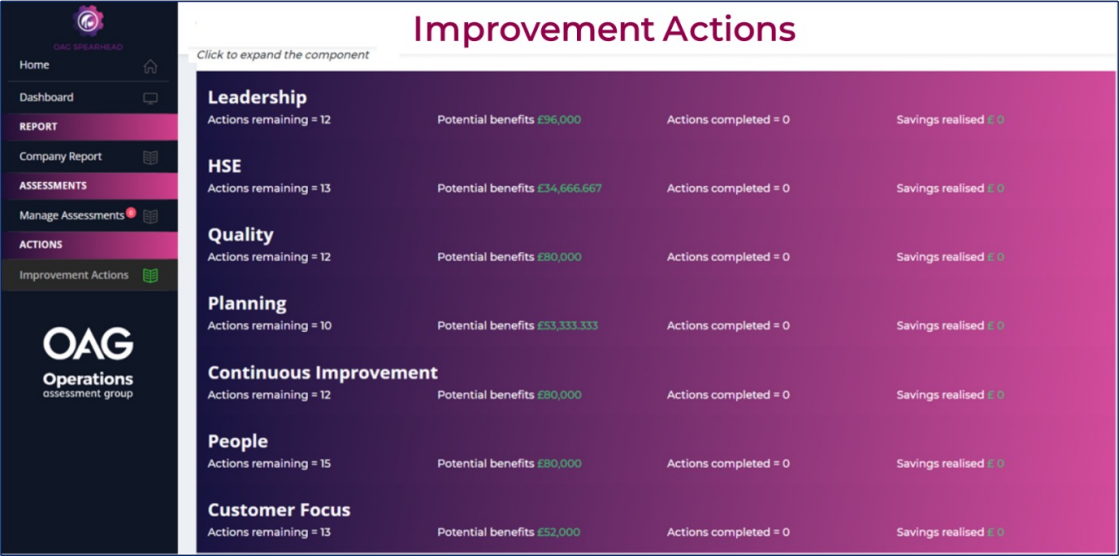
Improvement Actions
The dashboard also contains the improvement actions needed to achieve the aspirational goals for each component and the potential benefits in doing so. By selecting a component, its subcomponent actions will be displayed.
Component table (Improvement Actions)
For each component, the remaining actions, completed actions, potential benefits and realised benefits can be viewed. This indicates progress and can aid prioritisation.
Leadership Subcomponent table
The table displays the outstanding actions to achieve the aspiration goals for leadership. Resources can be allocated and progress monitored. Once completed, the action disappears from the Benefits Available table and the Benefits Realised table is updated in the Dynamic Dashboard.