
Financial Benefits Explained
Financial Benefits Explained
An OAG assessment sets strategic aspirations aligned with business objectives and establishes the current state for the 7 key components and their sub-components as shown in the OAG Model. It identifies the potential to improve effectiveness and in doing so enhance operational performance.
Operational performance is inextricably linked to gross margin performance. Improvements in operations will have a positive effect on financial performance.
This document explains how the financial benefits have been calculated.


The assessment sets aspirational goals for manufacturing that are aligned with the business objectives and identifies the current state of the operation. The resulting ‘effectiveness gap’ represents the improvement steps for each sub-component required to convert current to aspiration. These steps are detailed in the report and represent the foundation of a strategic plan for operations, accessed and updated via the dashboard as improvements are made.
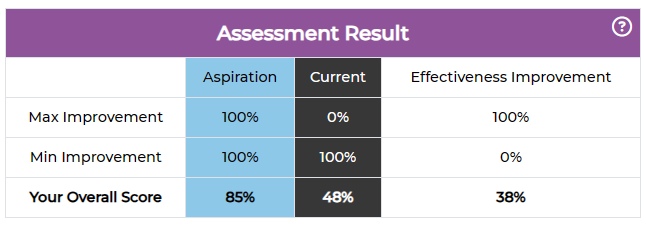
The table shows the improvement range and an assessment result example. The effectiveness improvement is the number used in the calculation.

OAG’s calculation of financial benefits is based on direct material through increased yield and direct labour through increased productivity.
OAG sets an experience-based default high-line and base-line for labour and materials. The table shows how the default maximum improvement has been arrived at.

Either use OAG’s default or enter your own maximum improvement in the highlighted data entry field.

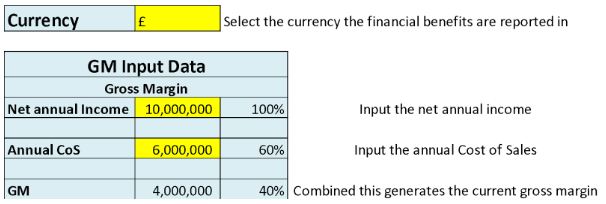
Enter currency, annual income and the annual cost of sales (CoS) for labour and materials to generate the current gross margin. This establishes the baseline for improvement.

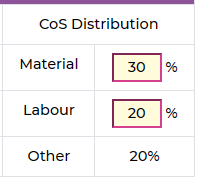
The financial benefits are derived from improving operational effectiveness by reducing direct material costs through increased yield and direct labour cost through increased productivity. Enter a percentage figure for the annual cost of materials and labour.

The table below assembles the input data and calculates the improvement to gross margin and the corresponding increase in gross profit for achieving your aspirations.
NB. The total monetary figure for gross margin is assigned equally to each sub-component improvement step on the journey from current to aspiration. The dashboard enables sub-component improvements to be registered and their impact viewed immediately.
